
I've long been fascinated by the uncanny valley concept and its theoretical foundations. Theorists propose that the uncanny valley is a disgust of human-like, but not-quite-human figures that stems from survival instinct — an avoidance mechanism tied to cues of death or disease.
I explored facial perception research to identify a specific pain point in artificial faces likely to trigger this response, then designed an experiment to test my hypothesis.


An early example of the uncanny valley: a humanoid robot
An uncanny character from The Polar Express
The theory proposes that as artificial human renderings approach realism, they reach a point that triggers strongly negative emotional responses. The phenomenon was originally proposed by roboticist Masahiro Mori in 1970; the term "uncanny valley" was introduced through a Jasia Reichardt translation in 1978.
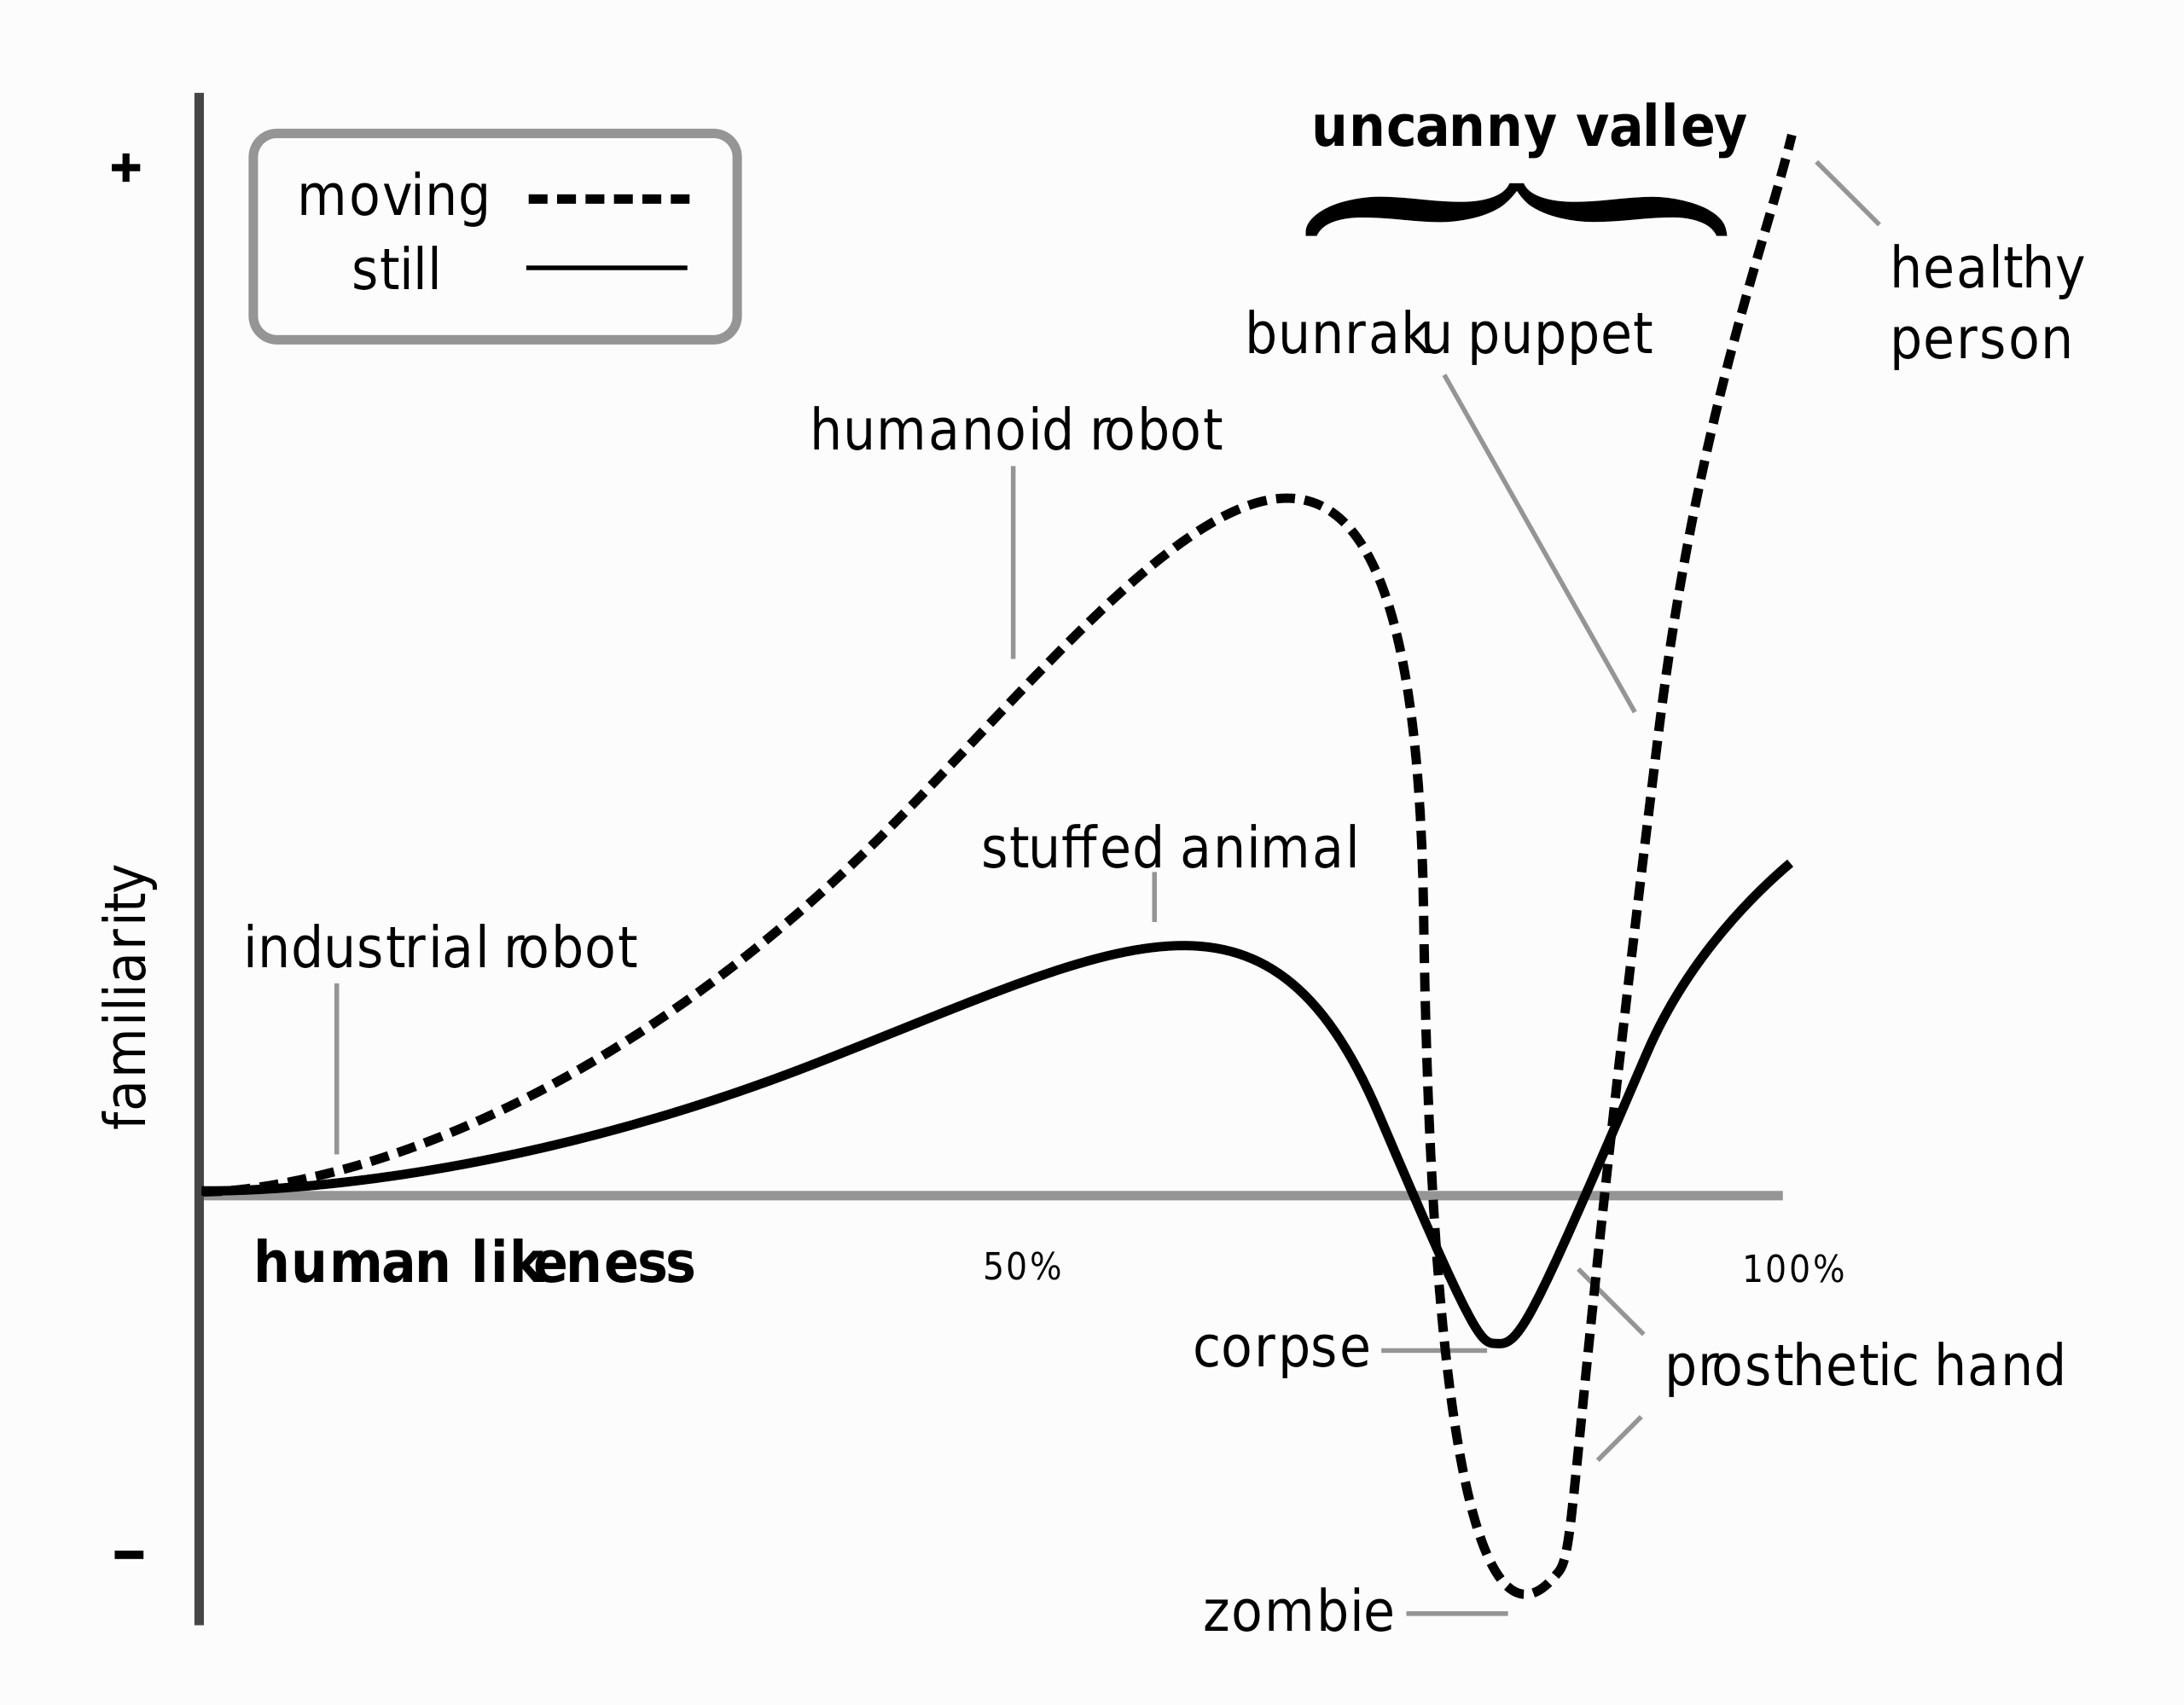
Mori's original uncanny valley graph — familiarity plotted against human likeness
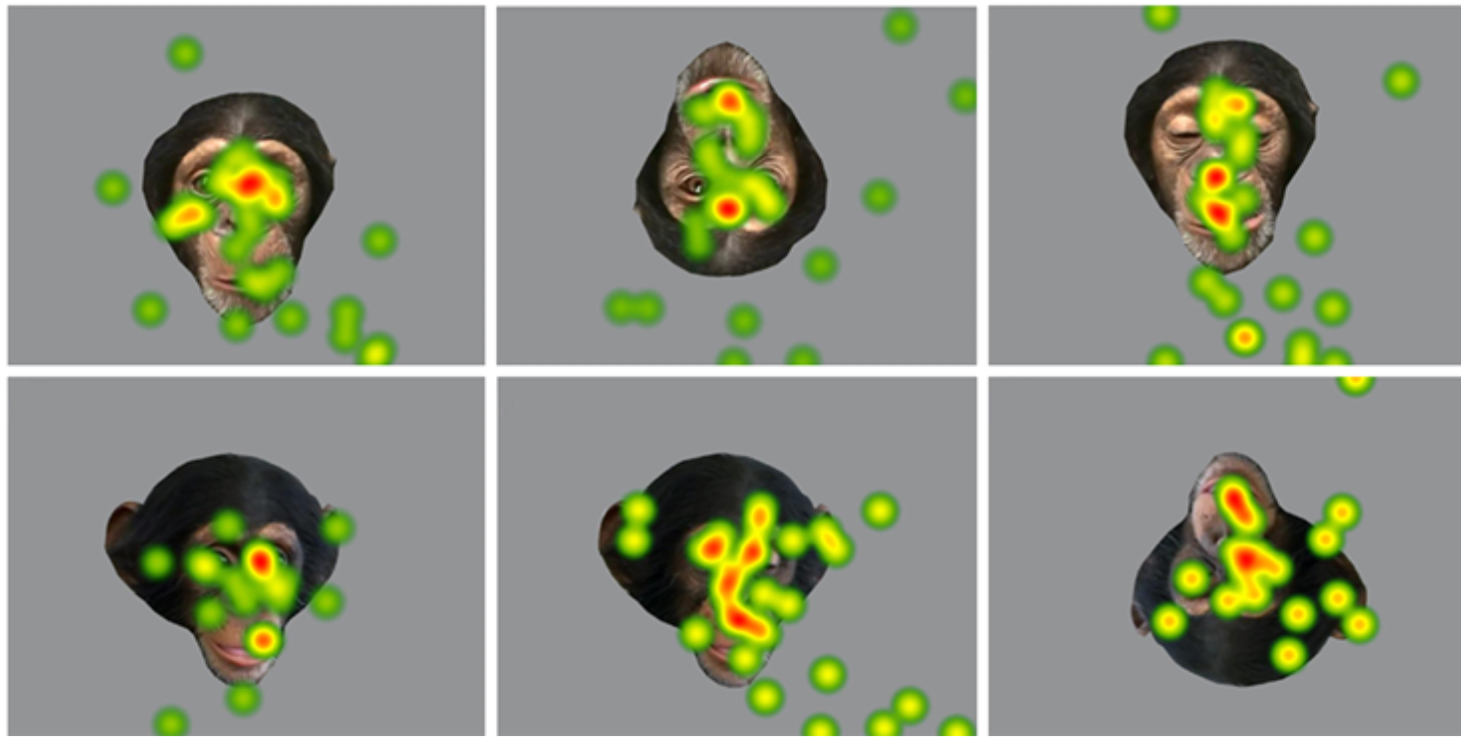
Research shows that humans fixate on the eye region 40% of the time when viewing a forward-facing face (Janik et al., 1978). Chimpanzee eye-tracking studies (Hirata et al., 2010) confirmed this pattern extends across species — attention centered on the eyes even when faces were rotated or inverted.
I hypothesized that if emotional connection flows primarily through the eyes, then eyes alone may be sufficient to trigger the uncanny valley response.
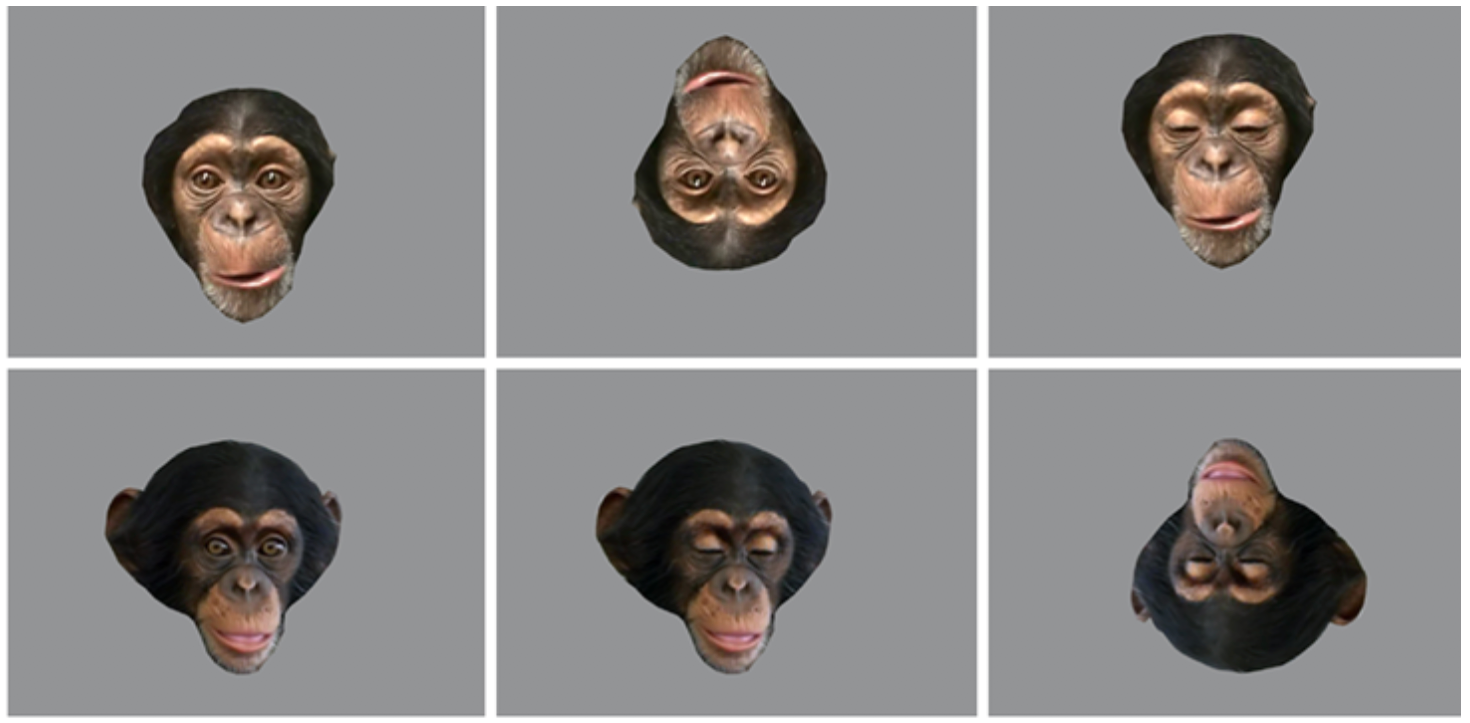
Chimp face variants used in eye-tracking research
Heatmaps showing attention distribution on chimp faces
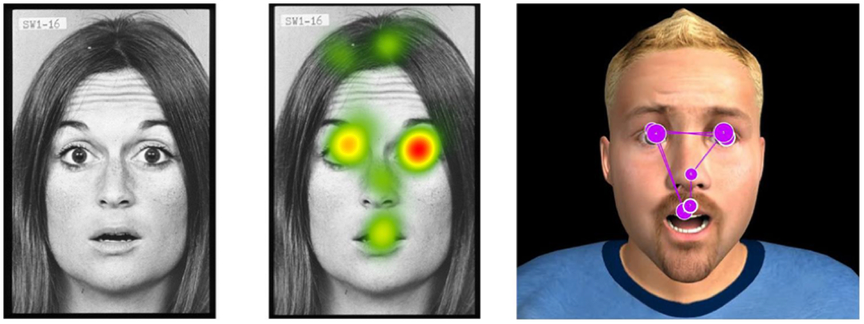
Eye-tracking data on human faces and 3D facial landmark tracking
Digitally produced eyes alone can trigger the uncanny valley effect.
Participants rated images on a 5-point scale ranging from "I HATE this" to "This is human." Eleven stimuli were created by morphing real video footage with a 3D uncanny digital human model at varying degrees of digital eye opacity.
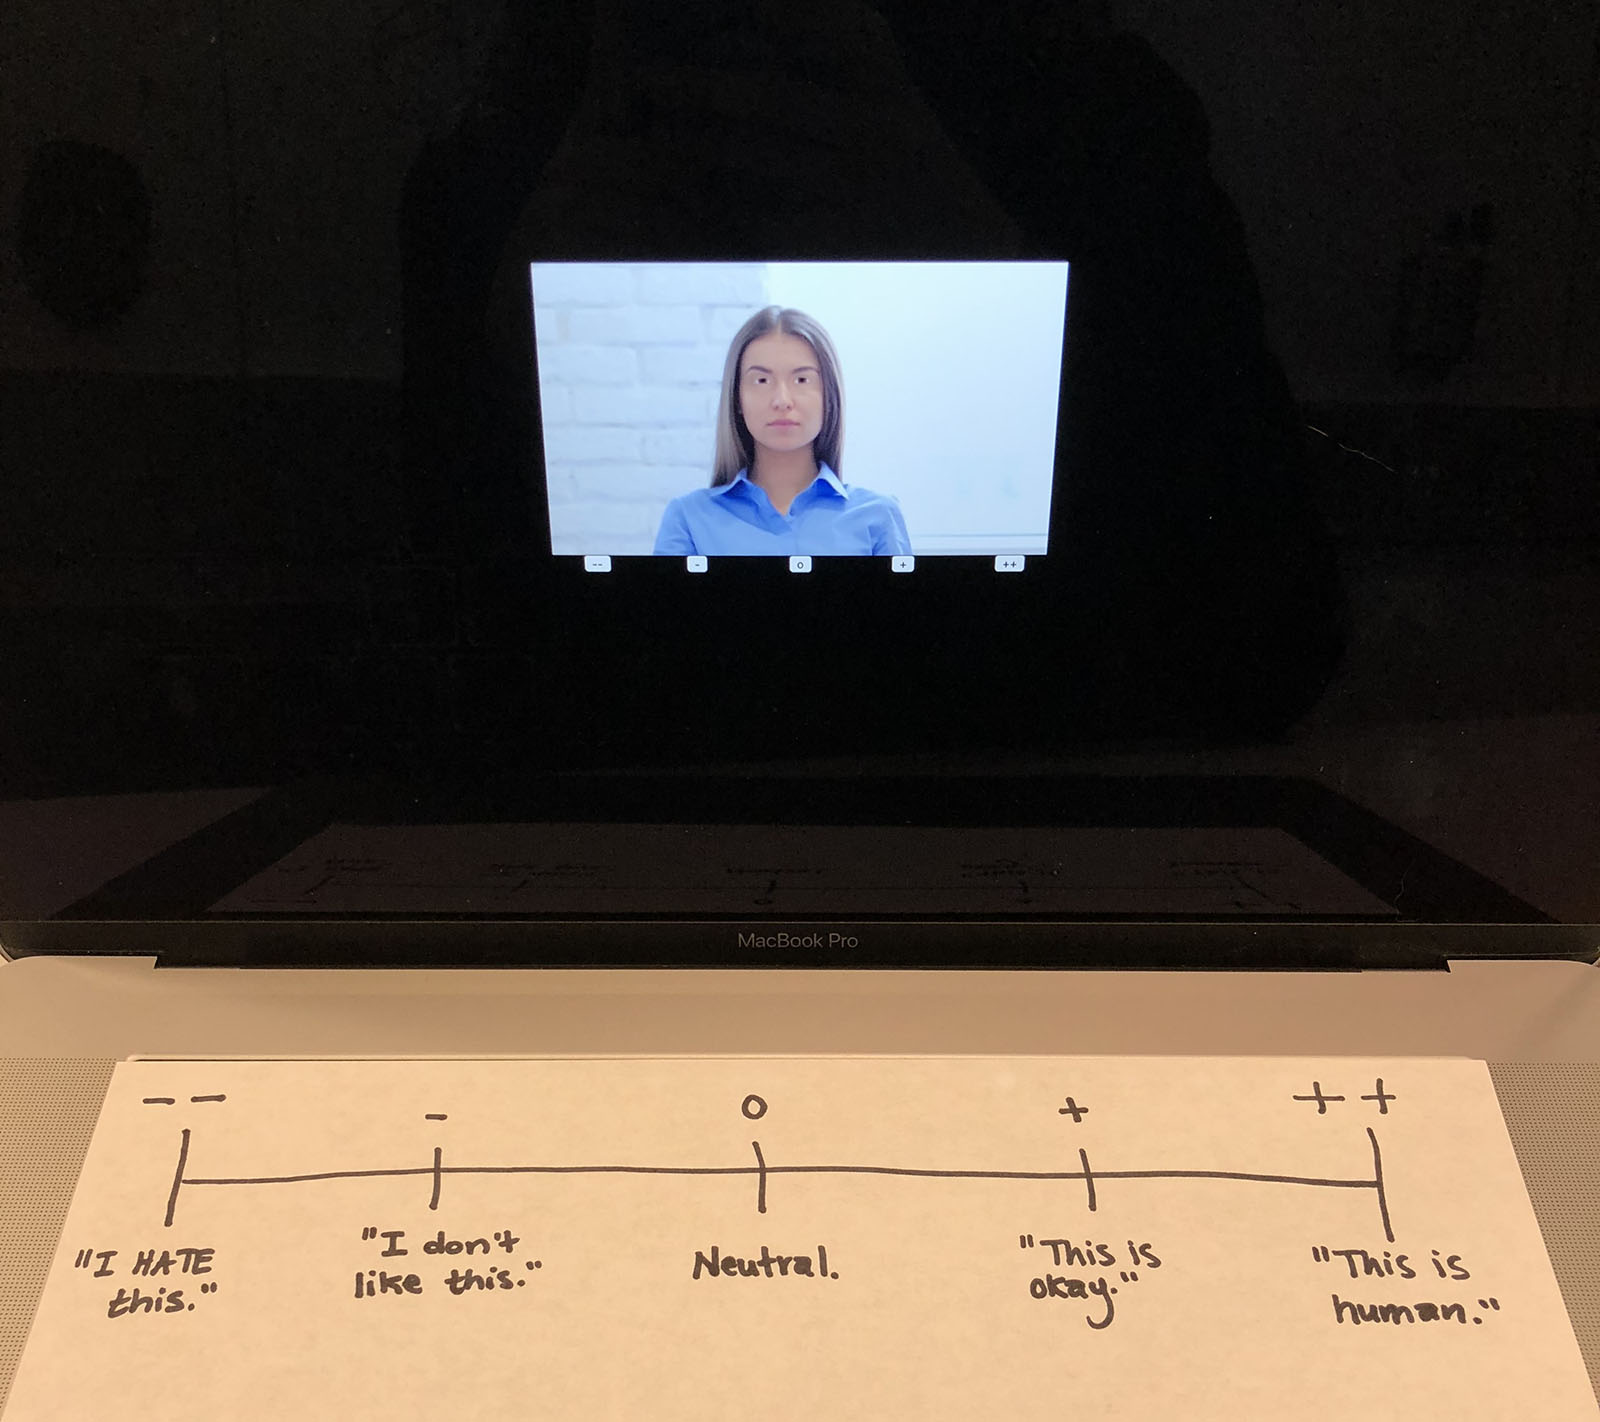

Rating interface with printed 5-point scale
The p5.js rating application
Eleven test stimuli were produced by morphing original stock footage with a 3D facial rig built in Autodesk Maya at increments from 10% to 100% digital eye opacity.

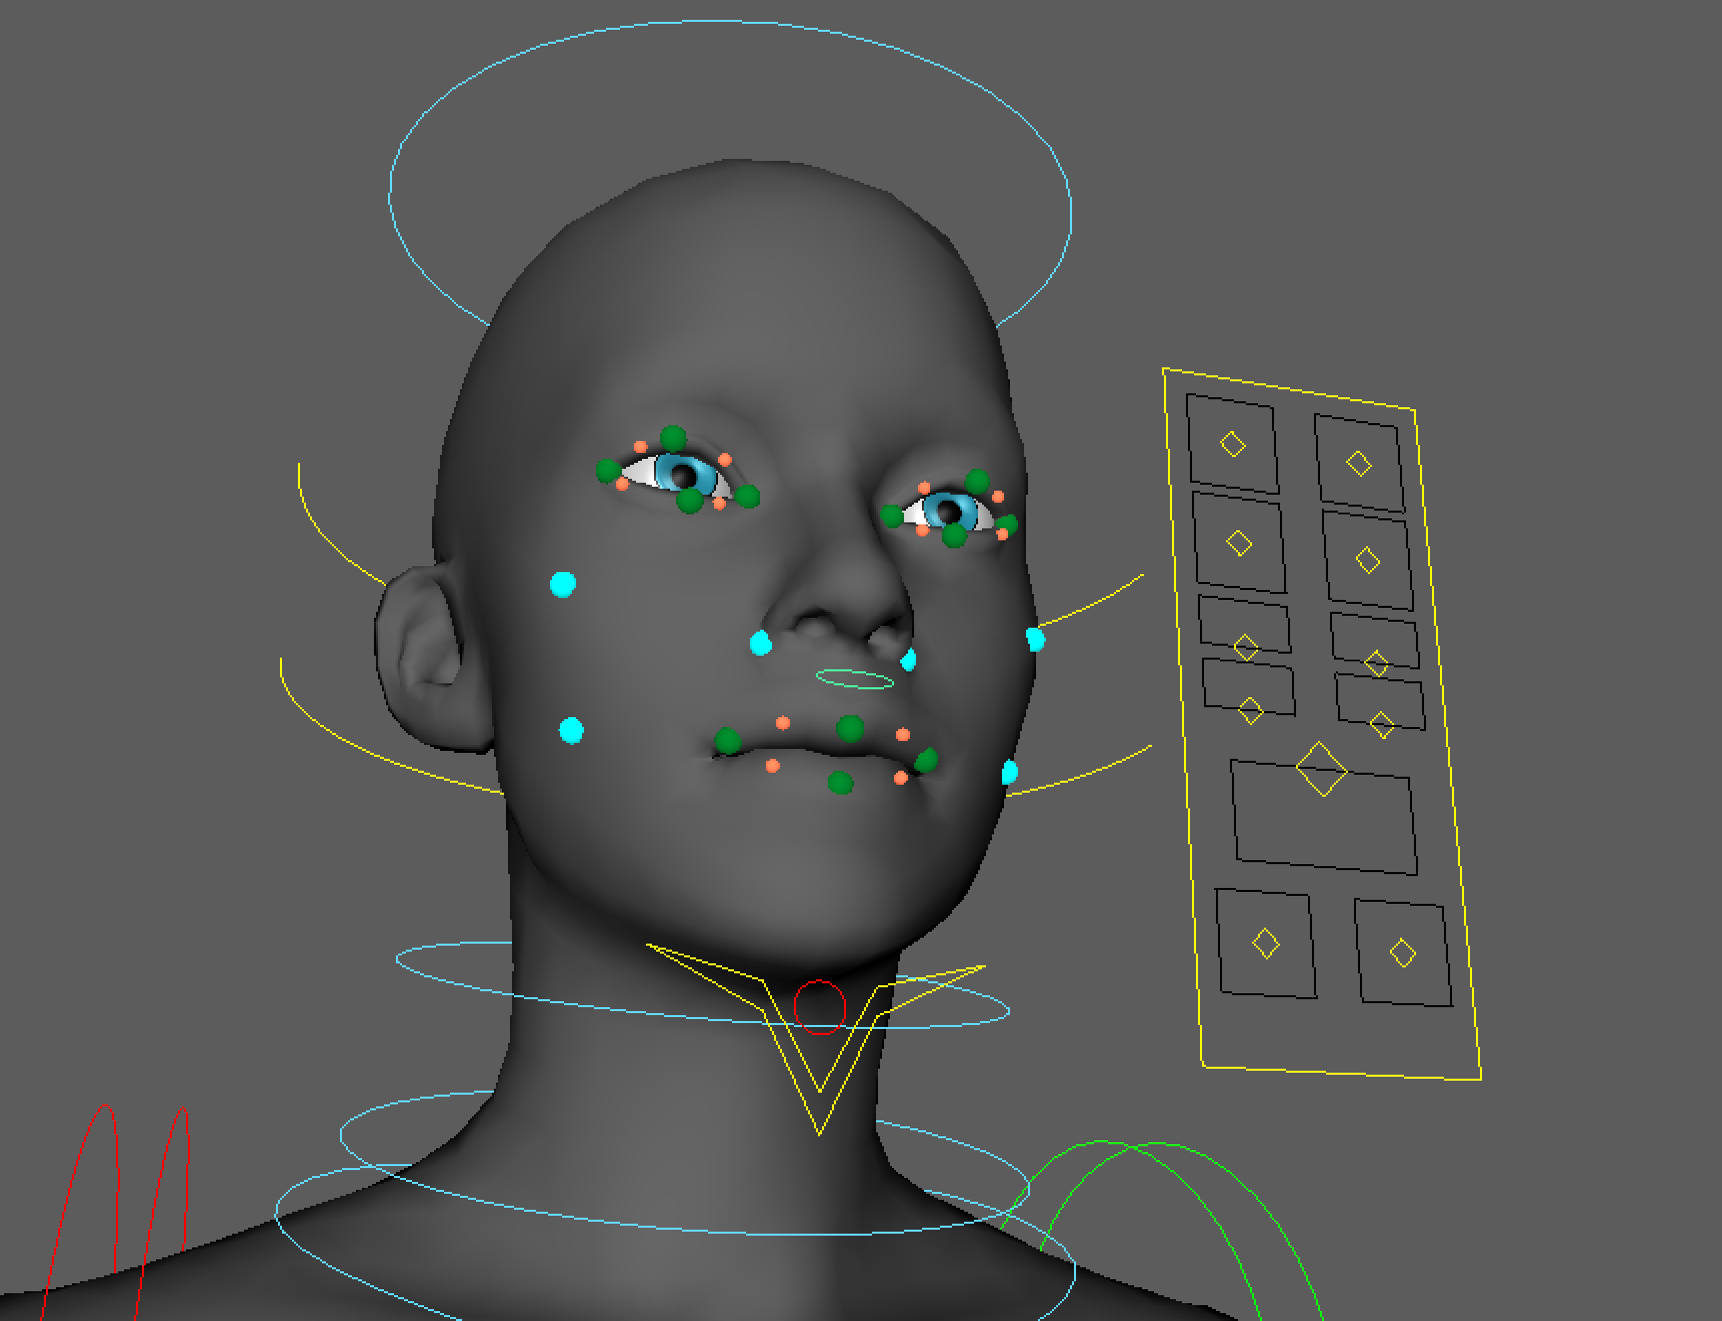

Original stock footage
Facial rig in Autodesk Maya
70% digital eye opacity
A local browser app built with p5.js displayed 11 looped 8-second videos in random order. Participants clicked one of five buttons to rate each clip — from "I HATE this; this is not human" to "This is a human." A printed scale was placed over the keyboard; only the trackpad was used to navigate.
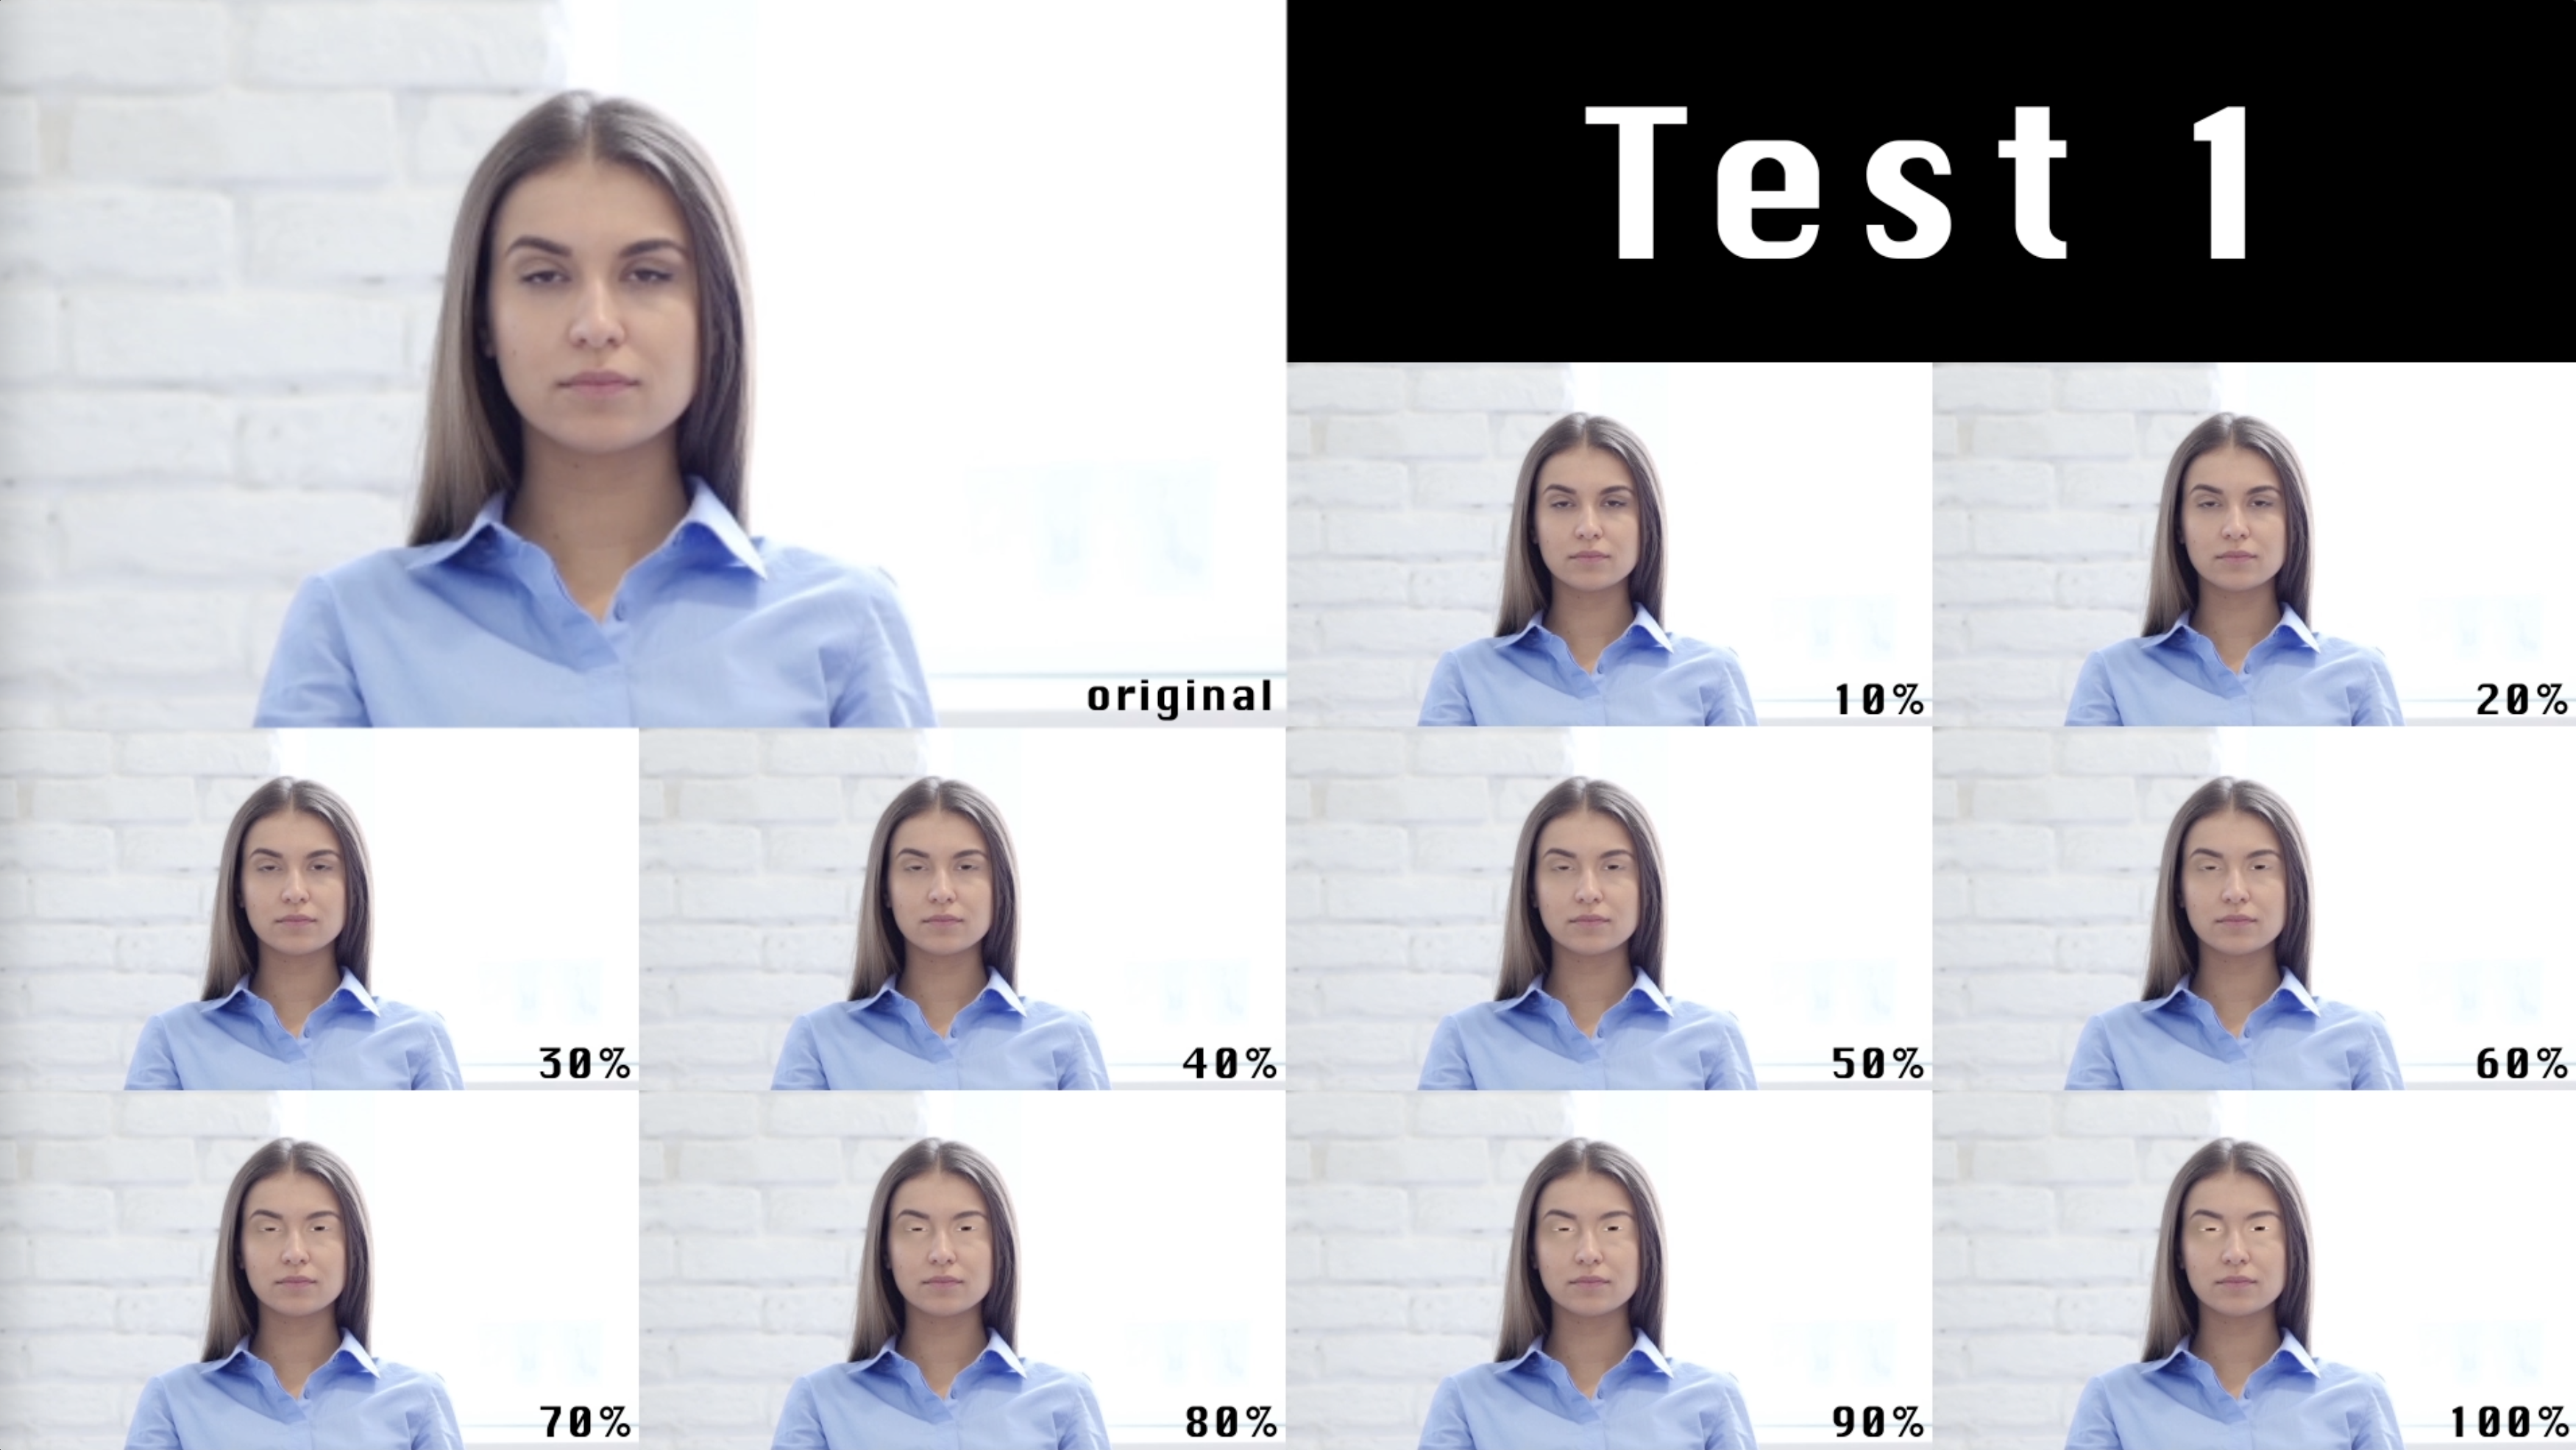
All 11 female test stimuli — original through 100% digital eye opacity
Experiment 2 used male stock footage to account for gender bias. Two updates were made to the app: response time (time between image load and button click) was now logged, and a start screen was added so participants were not exposed to the first stimulus during instructions.

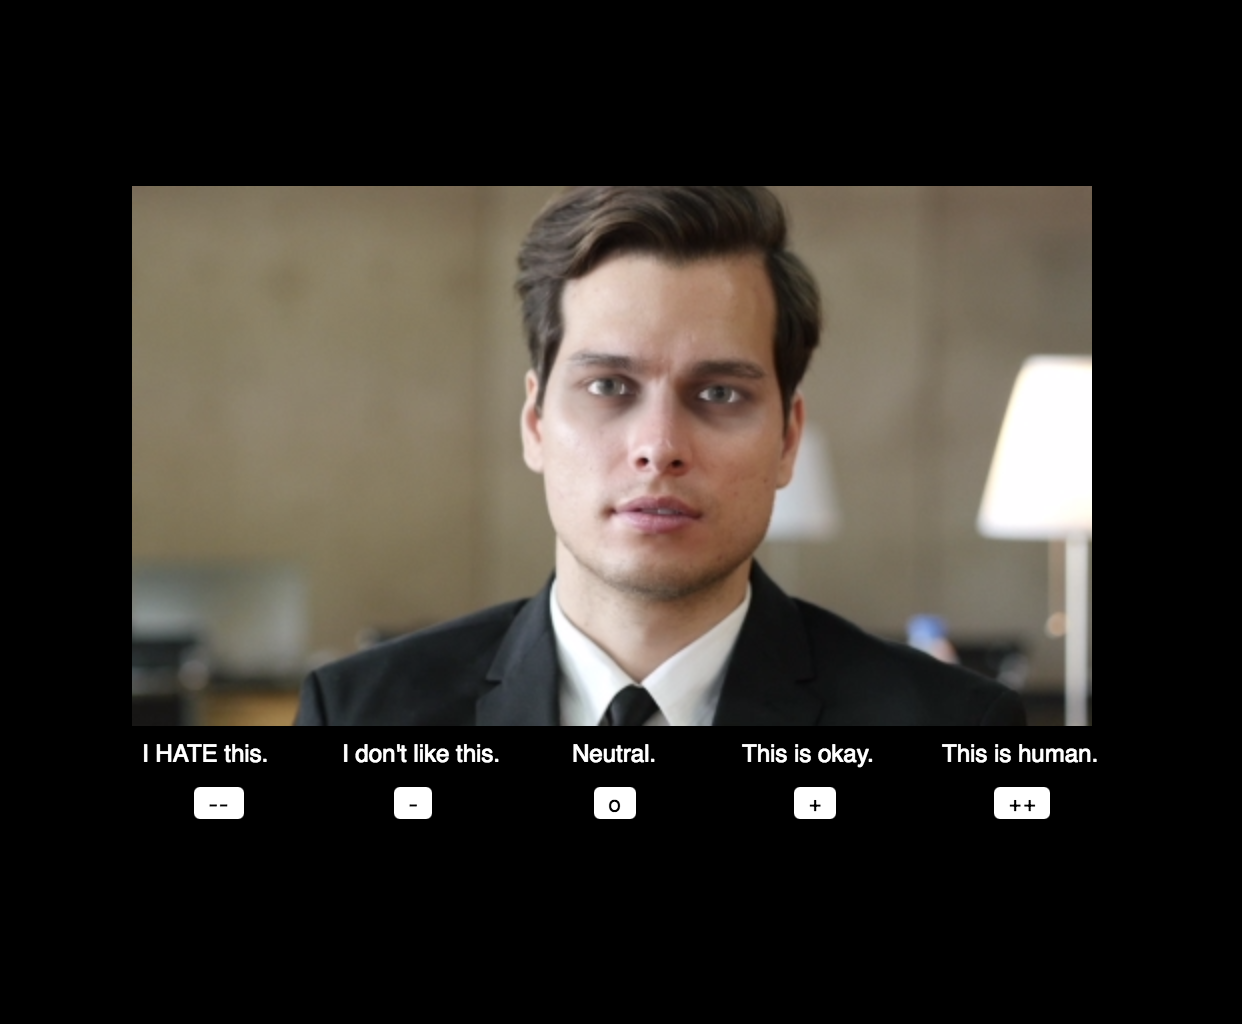
Start screen added for Experiment 2
Male stimulus in the rating interface
Ratings were converted to numerical values, averaged per image, and graphed against Mori's original uncanny valley curve. A notable pattern emerged: responses to earlier images in a session trended toward neutral, likely due to comparison effects from preceding stimuli.
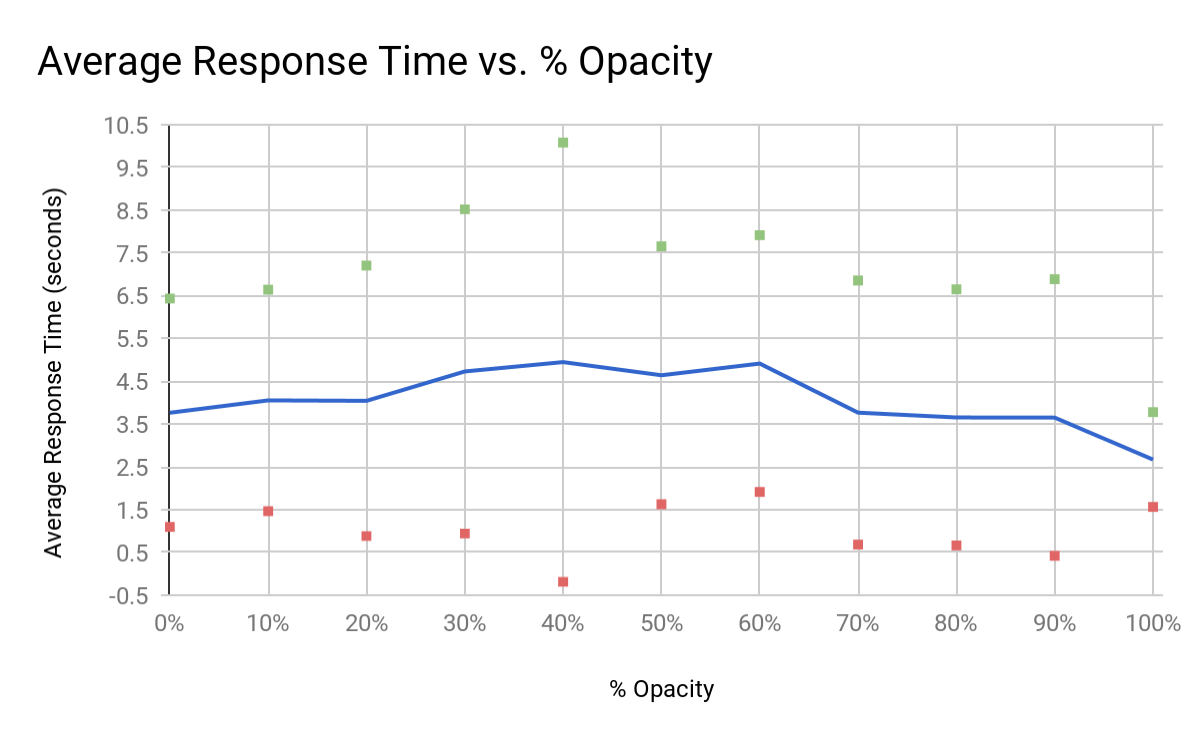
Experiment 2 introduced a response-time graph. Individual data sheets showed higher response times and more neutral ratings on first-viewed images which were expected to balance out across averaged trials.
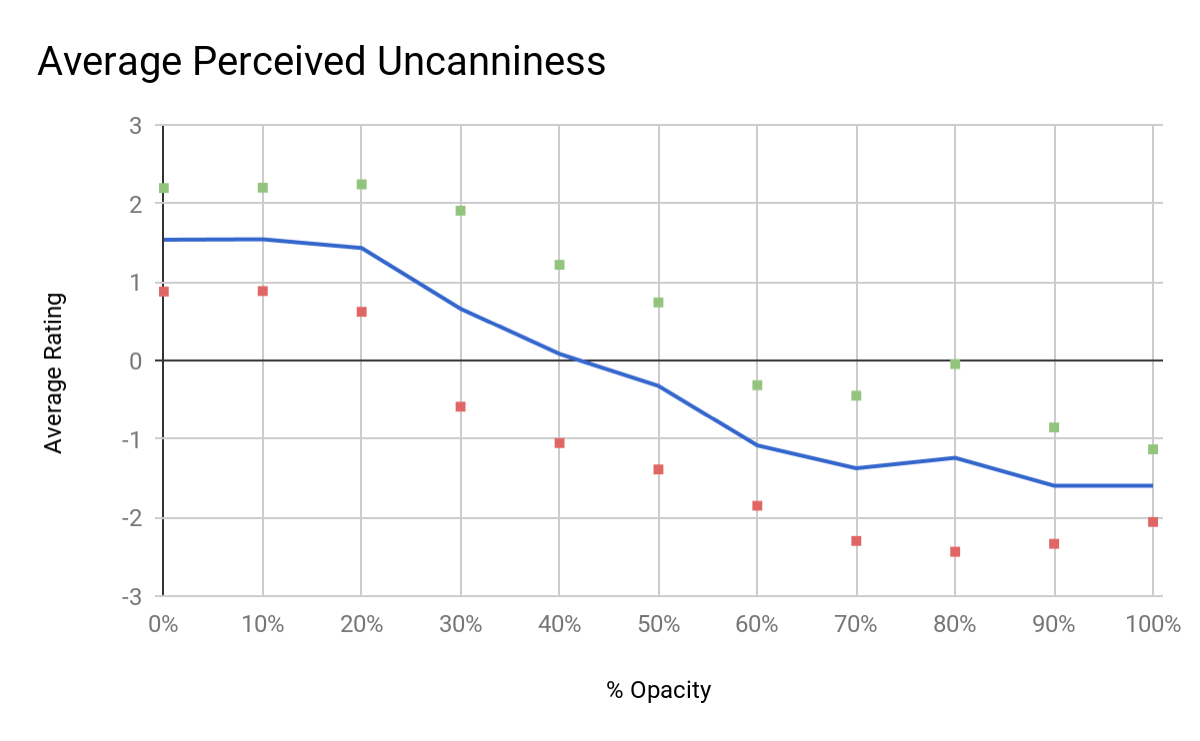
Experiment 1 — Average Perceived Uncanniness vs. % Opacity
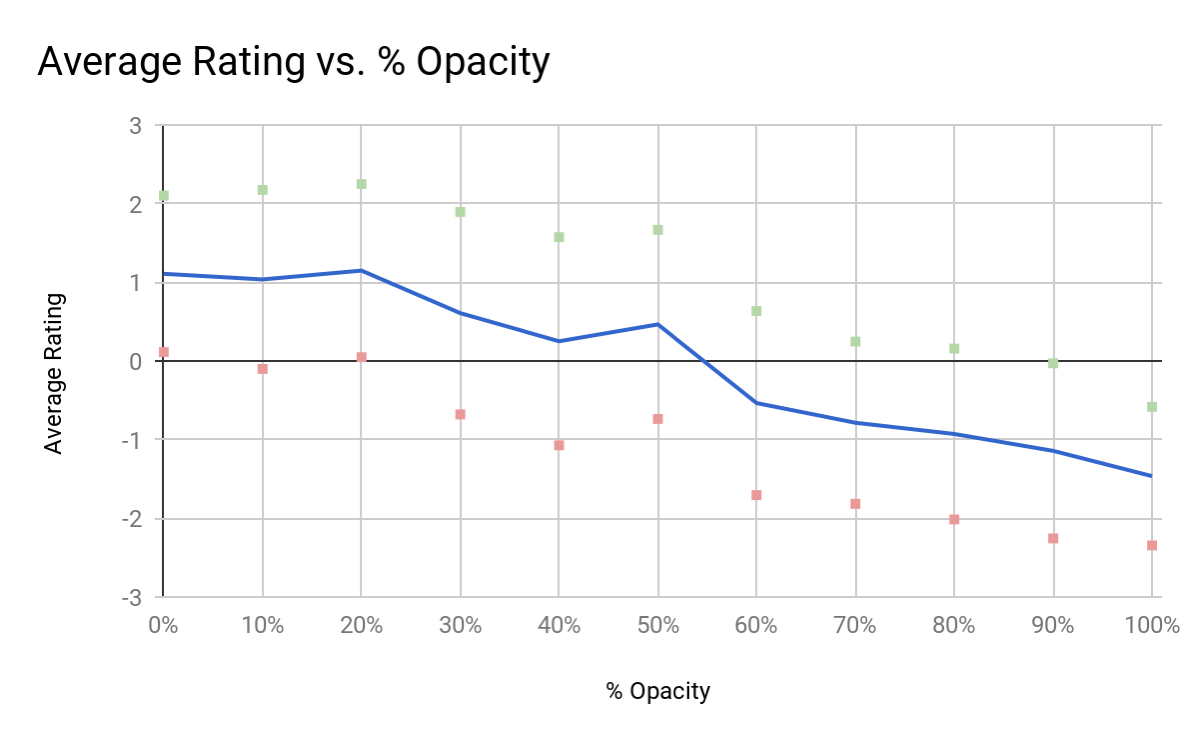
Experiment 2 — Average Rating vs. % Opacity
Experiment 2 — Average Response Time vs. % Opacity
Digital eyes triggered the uncanny valley effect in both rounds of testing
The uncanny turning point began at approximately 20% digital opacity
At 70% digital opacity, responses were overwhelmingly negative in both image sets
Fast response times indicated the eye region alone drove judgment of uncanniness without requiring full facial analysis
There was sufficient evidence to support the claim.